
How to Include and Exclude Filtered Data in Excel Functions

Using Excel can help you group large amounts of data in nearly any way you want to see the data. This helps find trends and patterns that can help build your business, reduce loss, track sales or inventory, and much more. A helpful time-saving feature is the ability to filter data. Filtering data provides a view of only those items you are interested in. Unfortunately, when using functions against filtered data you may get unexpected results, which can be challenging to find when you have very large amounts of data.
This post discusses how to apply the correct functions that will include or exclude filtered data in Excel so you end up with the data you expect.
Below is a video showing which functions to use for including and excluding filtered data.
How to Include and Exclude Filtered Data in Excel Functions
Filtering data is a great way to narrow down information when you have larger data sets. It can help you find trends in data, locate anomalies, find the most or least common of any category - like sales day of the week or item, just to name a few examples. If you were tracking inventory it could help you find what you have too much or too little of and much more!
For this post, our example data represents sales for a gardening store that tracks customer sales by day of the week, items and their number sold, and the total cost for those item.
To show how filtering data is handled by functions, we will first do a sum of all sold items so we have a number to compare to.
To include filtered data in functions
- Scroll to the bottom of the entered data by using the keyboard shortcut control + end.
- Click in a blank cell after the data to sum and click on the Greek E to the right of the Home tab.
- NOTE: If you click the E it will assume Sum, or you can click the arrow next to it and choose "Sum" from the drop down menu.
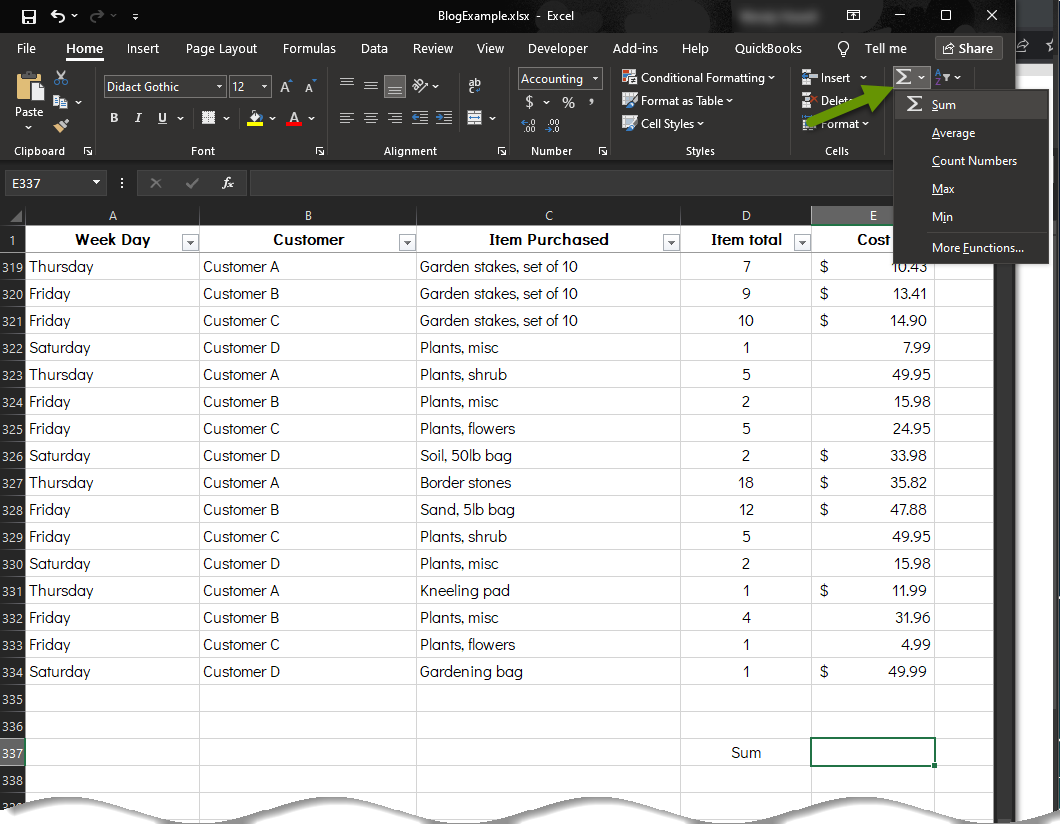
- The Sum function automatically assumes you want all the cells above or next to it, depending upon how your data is set up, as long as there are no empty cells. If empty cells exist, you will need to type in the cells to include because by default, the function will stop before the first empty cell.
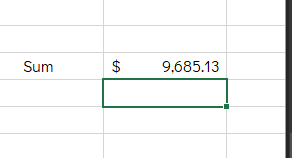
- Hit enter to set the function and the results of it will be displayed in the cell where the function was entered.
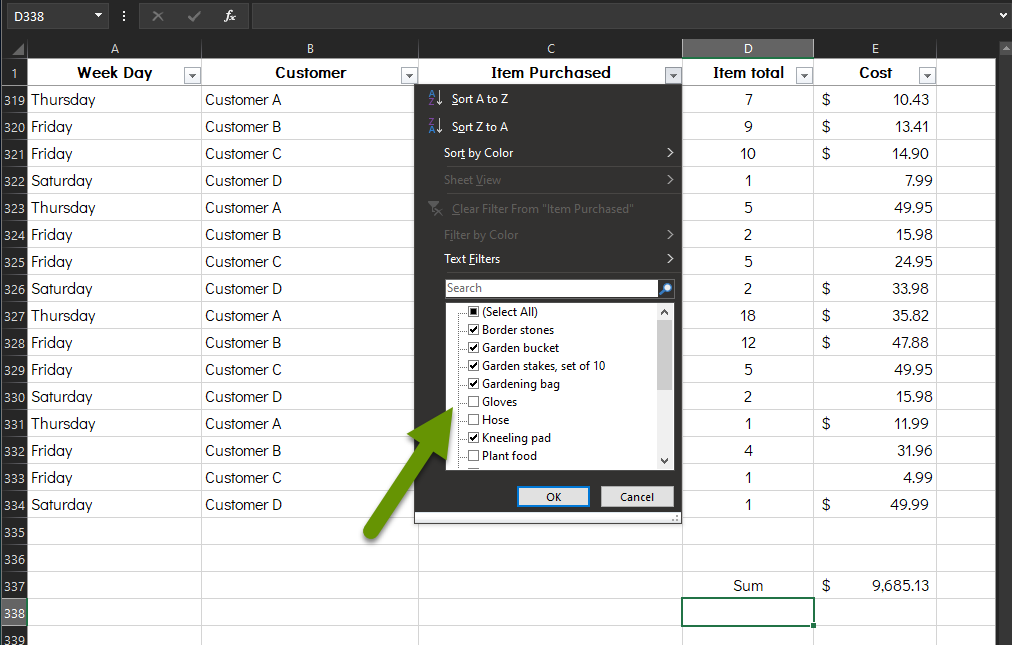
- Click the down arrow next to a column title and uncheck the box next to the data you want to filter out. Once all items have been filtered out, click "OK".
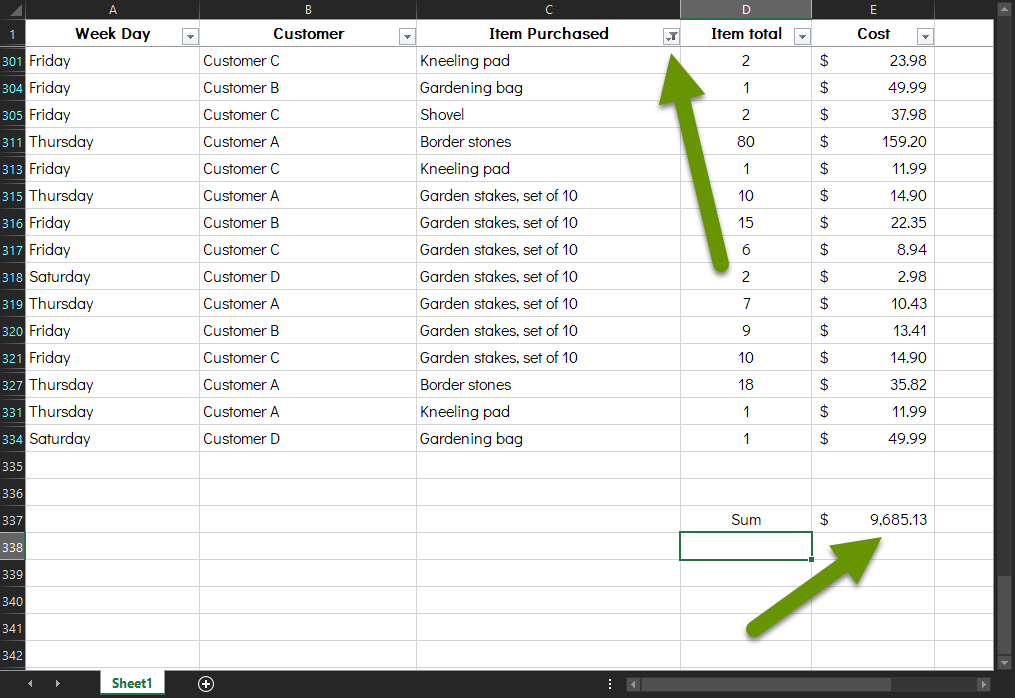
In the image below you will notice the data showing has changed. In this example, plants and some other items have been removed, but the total sales remains unchanged. This is because the Sum function counts the data in all cells, even if there is data filtered out.
You can also verify that data is filtered out because there is a filter icon next to the "Item Purchased" heading. Additionally, there are numbers being skipped in the row numbers. Lastly, the row numbers have changed color, also representing some of the data is being filtered out.
To exclude filtered data in functions
If you want to exclude the filtered data from being included in a function, you will need to use a different function than the Sum function.
- Scroll down to the bottom of the data by using the keyboard shortcut control + end.
- Click in a blank cell and type "=Subtotal(9,the data range)". The data range should be represented by a cell, then a colon, then another cell. For example, E2:E333, and this will include both the starting and ending cell.
- NOTE: The Subtotal function has several ways it can process data. The number 9 tells the Subtotal function to sum the data, but does so without including data that has been filtered out.
- Press enter to save the formula which will display the result of the function.
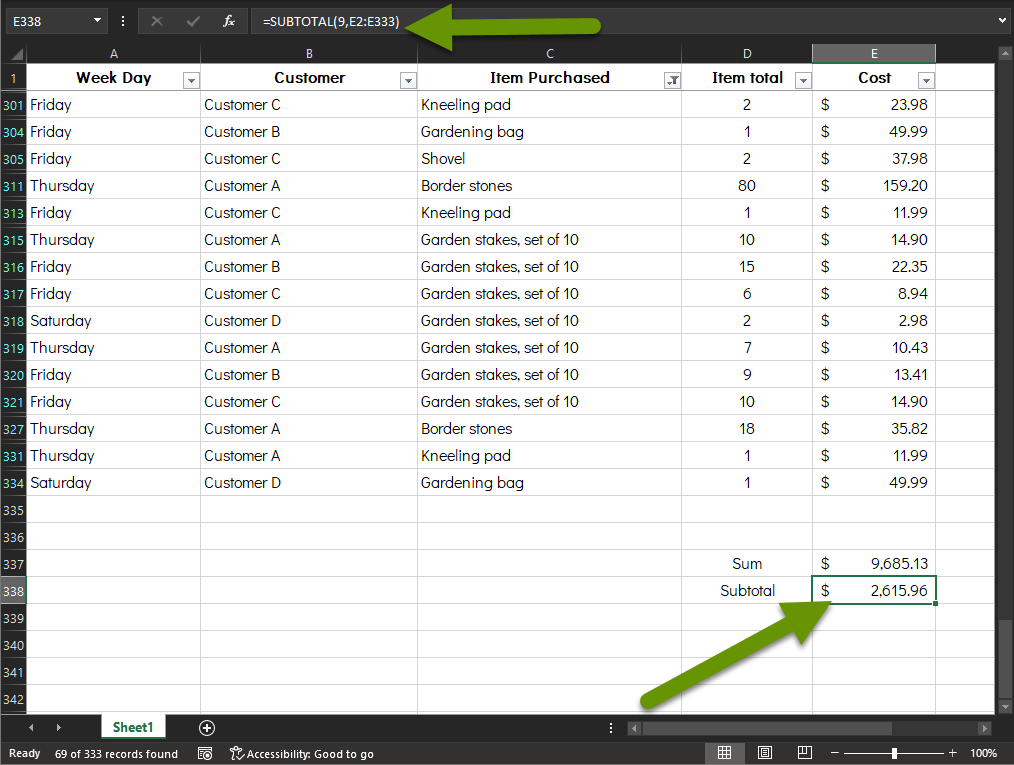
When you compare this result to the previous total, the difference is obvious. When using a Subtotal function, any data that has been filtered out is not included in the function results, even if it lives in cells that are included in the function. This is unlike the Sum function, which included the data in the filtered out cells.
This is a big distinction when you are trying to summarize large amounts of data and it is important to understand how the different functions work and how filtered data is processed. If you are working with a very small amount of data, it would be easy to see that a function was not giving you the result you wanted or expected. However, with larger amounts of data, and where you are more likely to need functions, it is important to be confident in the results of the functions you create.
Filtering data can change how functions process data. In this post we show the difference between how filtered data is included and excluded in Sum and Subtotal functions, respectively. Both functions are valuable and there will be times when you need both. However, you need to know what data you are capturing when using a function or the results of those functions will be useless.
As always, understanding how the data is being processed is very important when handling large amounts of data!